Goal 7Figures published c. 2005 by the World Bank. The Millennium Development Goals program concluded in 2015; this site is preserved as a historical record.
The environment provides goods and services that sustain human development so we must ensure that development sustains the environment. Better natural resource management increases the income and nutrition of poor people. Improved water and sanitation reduce child mortality, and better drainage reduces malaria. It also reduces the risk of disaster from floods. Managing and protecting the environment thus contribute to reaching the other Millennium Development Goals. Fortunately, good policies and economic growth, which work to improve people's lives, can also work to improve the environment. Target 9 Integrate the principles of sustainable development into country policies and programmes and reverse the losses of environmental resources. Target 10 Halve by 2015 the proportion of people without sustainable access to safe drinking water and basic sanitation. Target 11 Have achieved by 2020 a significant improvement in the lives of at least 100 million slum dwellers. Target 9 Charts on forest areas Chart on protected areas Chart on energy sources Chart on carbon dioxide emissions Carbon dioxide emissions map
Forests shrinking –
Forests contribute to the livelihoods of many of the 1.2 billion people living in extreme poverty. They nourish the natural systems supporting the agriculture and food supplies on which many more people depend. They account for as much as 90 percent of terrestrial biodiversity. But in most countries they are shrinking. Some loss of forest is an inevitable part of economic development. But because forests are undervalued in many places, they are subject to more destructive and unsustainable activities than is economically or environmentally justified. Forest area is land under natural or planted stands of trees, whether productive or not.
Protecting land areas to slow the loss of biodiversity –
Biological diversity, or biodiversity, refers to the variety of life on Earth, including the variety of plant and animal species, the genetic variability within each species, and the variety of different ecosystems. The Earth’s biodiversity is the result of millions of years of evolution of life on this planet. But human activities are causing losses in biodiversity 50 to 100 times faster than would be expected in the absence of human activities.
Increase in the protected sites during the last 30 years
In response to the pressure on biodiversity, several international conventions have been developed to conserve threatened species. One of the most widely used approaches for conserving habitat is to designate protected areas, such as national parks. The total area of protected sites has increased steadily in the past three decades.
Energy use and a warmer world –
The Earth’s climate has warmed by about 0.9 degrees Fahrenheit this century and much scientific evidence suggests that human activities have contributed to this. The burning of coal, oil, and natural gas and the cutting of forests are changing the atmospheric concentration of green-house gases, changing our planet’s climate, with far-reaching consequences. The direction and magnitude of climate change vary across regions, but developing countries are likely to suffer most because of their dependence on climate-sensitive activities – such as agriculture and fisheries. They also have limited capability to respond to climate change.
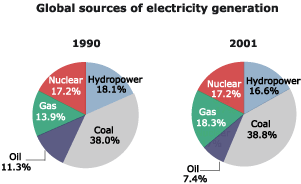
Change in the sources of electricity since 1980
By far the most common way to satisfy the need for energy in modern economies is through burning fossil fuels, such as coal, oil, and natural gas, that cause carbon dioxide emissions. Fossil fuel use has increased more than fourfold since 1950. The composition of sources is also changing. In the last 20 years, the use of coal and gas for electricity has increased relative to other sources, while the use of oil has shrunk dramatically.
Carbon dioxide emissions mean faster warming –
The extensive use of fossil fuels in recent decades has boosted carbon dioxide emissions – a major contributor to global warming. Out of estimated 6 to 7 billion tons of carbon dioxide released each year by human activities, some 2 billion tons are absorbed by oceans, and another 1.5 to 2.5 billion by plants, with the rest released in the atmosphere. The level of carbon dioxide in the atmosphere is up by some 30 percent since the beginning of the industrial revolution. According to the Intergovernmental Panel on Climate Change, the rate and duration of warming in the 20th century are unprecedented in the past thousand years – the global average surface temperature has increased by about 1.1 degrees Fahrenheit. The warming is expected to continue, with increases projected to be in the range of 2.5 to 10.4 degrees Fahrenheit between 1990 and 2100.
Energy use and carbon dioxide emission for different countries
The world’s growing population, with its desire for economic growth and a better quality of life, is raising the demand for energy. High-income countries, with 15 percent of the world’s population, use half the energy in the world, and produce more than half the global emission of carbon dioxide. Carbon dioxide emissions are those stemming from the burning of fossil fuels and the manufacture of cement. They include contributions to the carbon dioxide produced during consumption of solid, liquid, and gas fuels and gas flaring. Halve by 2015 the proportion of people without sustainable access to safe drinking water and basic sanitation Chart on People with access to safe water sanitation facilities
Clean water contributes to better health –
Lack of clean water and basic sanitation is the main reason diseases transmitted by feces are so common in developing countries. In 1990 diarrhea led to 3 million deaths, 85 percent of them among children. Between 1990 and 2000 about 900 million people obtained access to improved water sources, gains just sufficient to keep pace with population growth. An improved water source is any form of water collection or piping used to make water regularly available. It is not the same as “safe water,” but there is no practical measure of whether water supplies are safe. Connecting all households to a reliable source of water that is reasonably protected from contamination would be an important step toward improving health and reducing the time spent collecting water.
Change in the proportion of people with access to safe water
More people have access to safe water compared to 10 years ago. But, in 2000, 1.2 billion people still lacked access to an improved water source, 40 percent of them in East Asia and Pacific and 25 percent in Sub-Saharan Africa. Meeting the Millennium Development Goals will require providing about 1.5 billion people with access to safe water and 2 billion with access to basic sanitation facilities between 2000 and 2015.
Water in higher demand
Each year 80 million additional people will tap the earth’s water. In the past century, global water withdrawals have increased almost tenfold. Some countries have abundant, untapped stores of water to support growth well into the future. But others are already using most of their water, and major increases in supplies will be expensive. Far from plentiful, rural water has to be shared by the growing cities, the burgeoning rural areas, and a thirsty environment. Needed are greater efficiency in the use of water and fair allocation to balance the limited supply with rising demand.
Many in the Middle East and North Africa suffer from lack of freshwater
Freshwater resources per capita, 2000 refer to total renewable resources, which include internal flows of rivers and groundwater from rainfall in the country, and river flows from other countries. Freshwater resources per capita are calculated using the World Bank’s population estimates.
Improved sanitation reduces health risks
Along with safe water, improved sanitation services and good hygiene practices are needed to reduce the risk of disease. Access to basic sanitation system provides disposal facilities that can effectively prevent human, animal, and insect contact with excreta. Such systems do not, however, ensure that effluents are treated to remove harmful substance before they are released into environment.
Change in the proportion of people with access to improved sanitation
Over the period 1990-2000, access to improved sanitation increased globally from 45 to 55 per cent. Despite these gains, in 2000 about 3.4 billion people still lacked access. The gap between rural and urban areas remains extremely wide, especially in Eastern and South-central Asia. Halving the proportion of the world’s population without improved sanitation by 2015 will require reaching an additional 2 billion people, a challenge for greater financing and more effective sanitation programs.
Slum dwellers exposed to high risks and deprivation
Slums are the stage to the most acute scenarios of urban poverty, physical and environmental deprivation. Approximately one-third of the urban population globally live in these conditions. Typical slums in developing countries are unplanned informal settlements where access to services is minimal to non-existent and where overcrowding is the norm. Slum conditions result in placing residents at a higher risk of disease, mortality and misfortune. 94% of the world's slum dwellers live in developing regions, which are the regions experiencing the most rapid growth in urban populations and with the least capacity to accommodate this growth. Where available, trend data indicate that this problem is worsening. UN-HABITAT estimates that in 2001there were 924 million slum dwellers in the world and that without significant intervention to improve access to water, sanitation, secure tenure and adequate housing this number could grow to 1.5 billion by 2020.